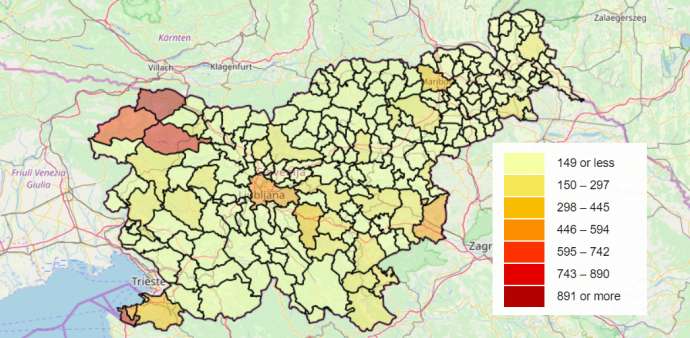
Ever wondered where all the second homes are in Slovenia, the vikendi and those defined by the Statistical Office of the Republic of Slovenia (Statistični urad Republike Slovenije – SURS) as “dwellings reserved for seasonal and secondary use”? If so, wonder no more as we zoom in the data for 2018, the most recent year for which it’s available.
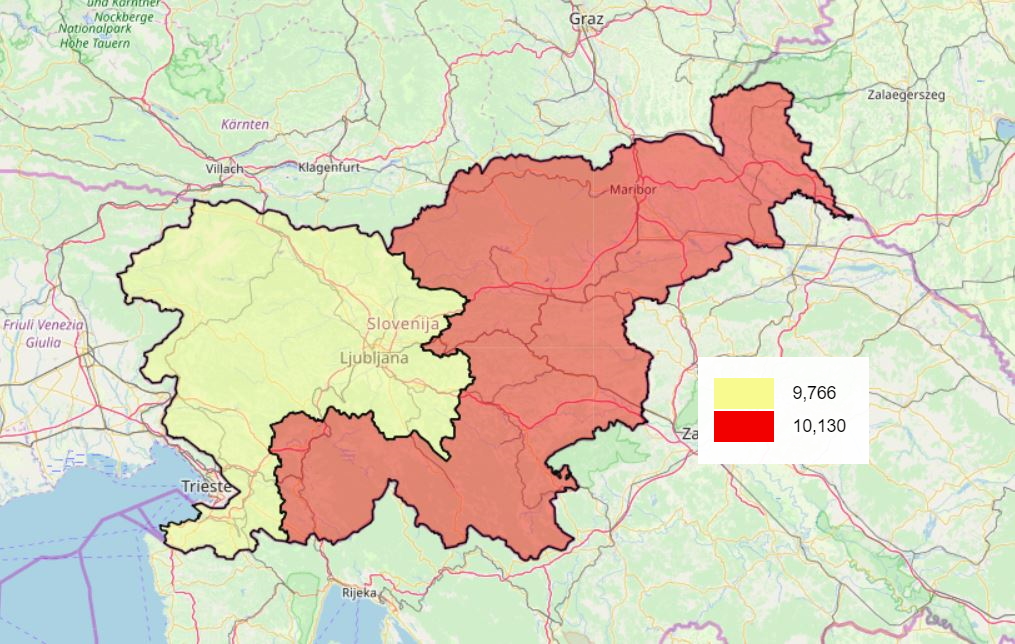
According to SURS, in 2018 there were a total of 19,896 such dwellings in Slovenia. Of these, 9,766 (49%) were in the west, and 10,130 (51%) in the east.
But that scale, the two “cohesion regions”, hides a lot of detail, and if we look at the 12 statistical regions then something become clear: that Gorenjska (AKA Upper Carniola) seems to be the most desired location, with 3,376 holiday homes, or just under 17% of the total, as seen in the following map and table.
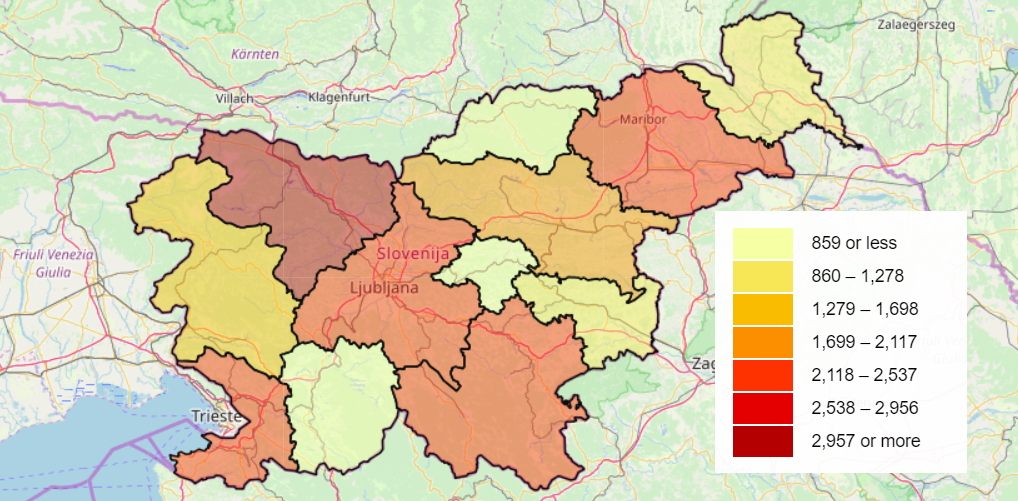
| Slovene | English | # | % |
| Gorenjska | Upper Carniola | 3,376 | 5.22 |
| Osrednjeslovenska | Central Slovenia | 2,489 | 12.51 |
| Obalno-Kraška | Coastal–Karst | 2,333 | 11.73 |
| Jugovzhodna Slovenija | Southeast Slovenia | 2,324 | 11.68 |
| Podravska | Drava | 2,168 | 10.90 |
| Savinjska | Savinja | 2,078 | 10.44 |
| Goriška | Gorizia | 1,568 | 7.88 |
| Posavska | Lower Sava | 1,037 | 5.21 |
| Pomurksa | Mura | 988 | 4.97 |
| Koroška | Carinthia | 650 | 3.27 |
| Zasavska | Central Sava | 446 | 2.24 |
| Primorsko-Notranjska | Littoral–Inner Carniola | 439 | 2.21 |
And the most popular place to buy a holiday home in Slovenia is...
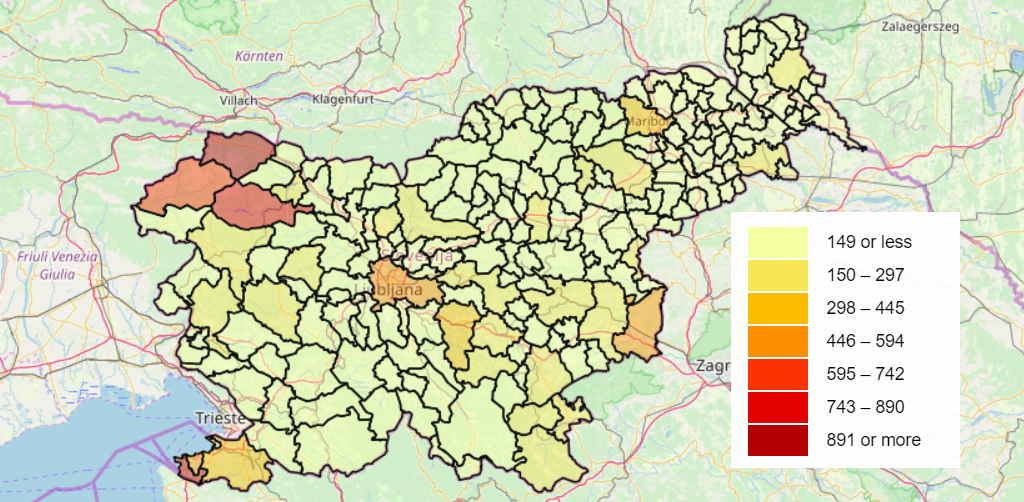
Now zooming in to the highest level of detail that SURS offers – the 212 municipalities – we can see that there are seven areas where there are more than 500 holiday homes: Piran (1,038), Kranjska gora (961), Bohinj (843), Bovec (608), Brežice (526), Ljubljana (523), and Izola (512). You can visit an internactive version of the map below here and learn more, if wanted, while if you’re interested in more statistics about Slovenia then all our related stories are here.
If you’re curious about some of the homes on the market, then check our real estate section, while all our stories on property are here.

